

Written by James Plender, Solutions Engineer

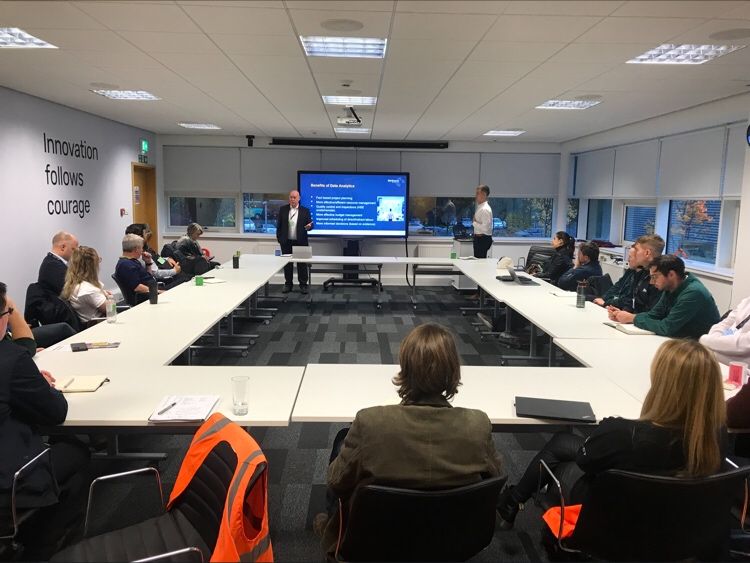
This year’s BE-ST Fest ’23 Summit was a resounding success. From thought-provoking keynote speakers to inspirational exhibits and workshops.
Following on from their successful breakout session, our Solutions Engineer, James Plender highlights what our product, Lumen® does to help BE-ST and the construction industry.
The BE-ST construction dashboards which can be found here were built with the aim of tracking progress and performance across a number of different segments of the Scottish construction industry. Through the analysis of the construction sector, these dashboards aimed to influence future research and inform decision-making and policy.
Lumen® formed the brains of these dashboards by performing the processing of the underlying data seamlessly in the background. Twelve different data sources from seven different organisations were brought into the platform. With these connections, Lumen® automatically checks every single day (even Christmas) if there is any new information that has been published by the relevant sources.
What is particularly technically complex about this application was that each of the data sources we connected to was formatted completely differently. This was inherited from the multitude of different organisations we were obtaining data from with each having their quirks regarding how their data is stored and formatted.
This challenge was overcome however by the fact that data connections in Lumen® can be formed using flexible programming languages such as Python. As a result, each connection could be customised such that data flowed into lumen where it could then be formatted and processed as required.
Processing in this application takes the form of calculations regarding quantities such as year-on-year percentage changes and cumulative totals. Whilst these statistical measures are quite simple, they add another layer of analysis to the dashboards which gives them more depth.
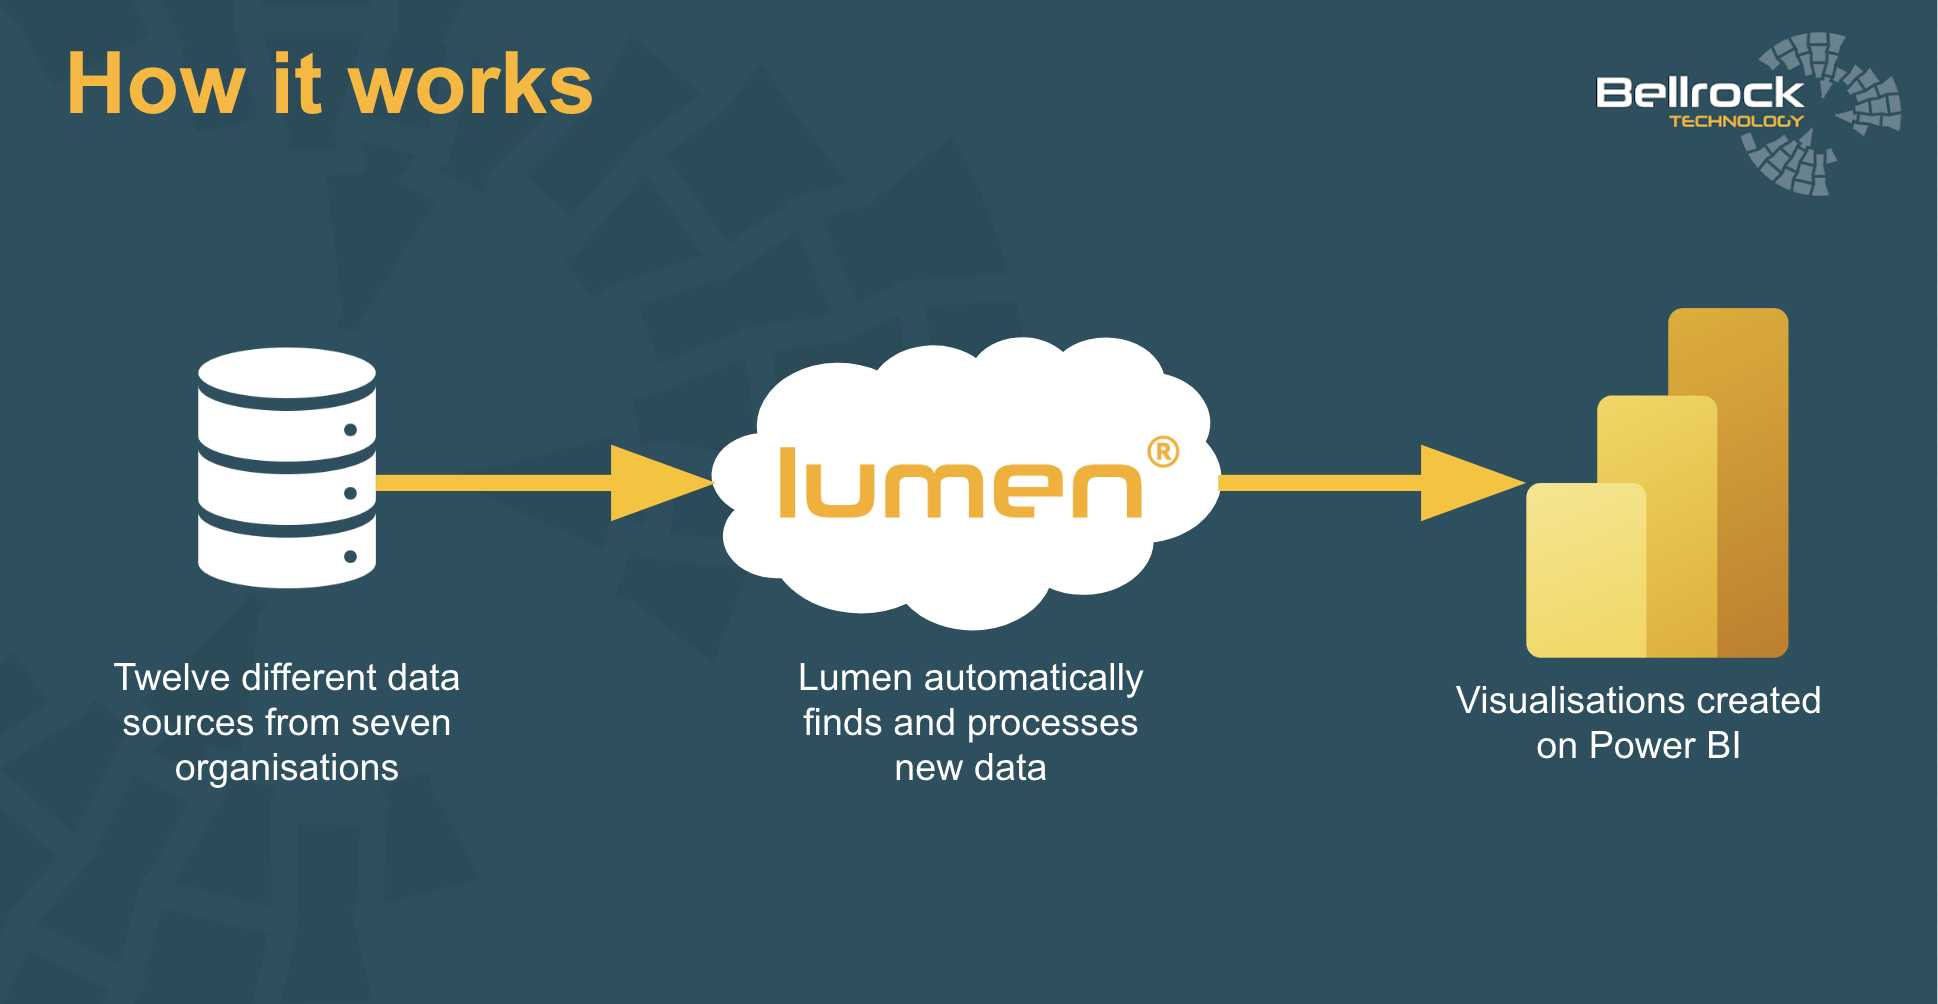
The processed data is exported from Lumen® to powerBI where the dashboards have been constructed. This is just one example of how lumen can export data that has been processed on the platform to your application of choice. This could be an external dashboarding service, an automatic email you receive or integration with the services you already use within your business (think CRM, OMS or WFMS).
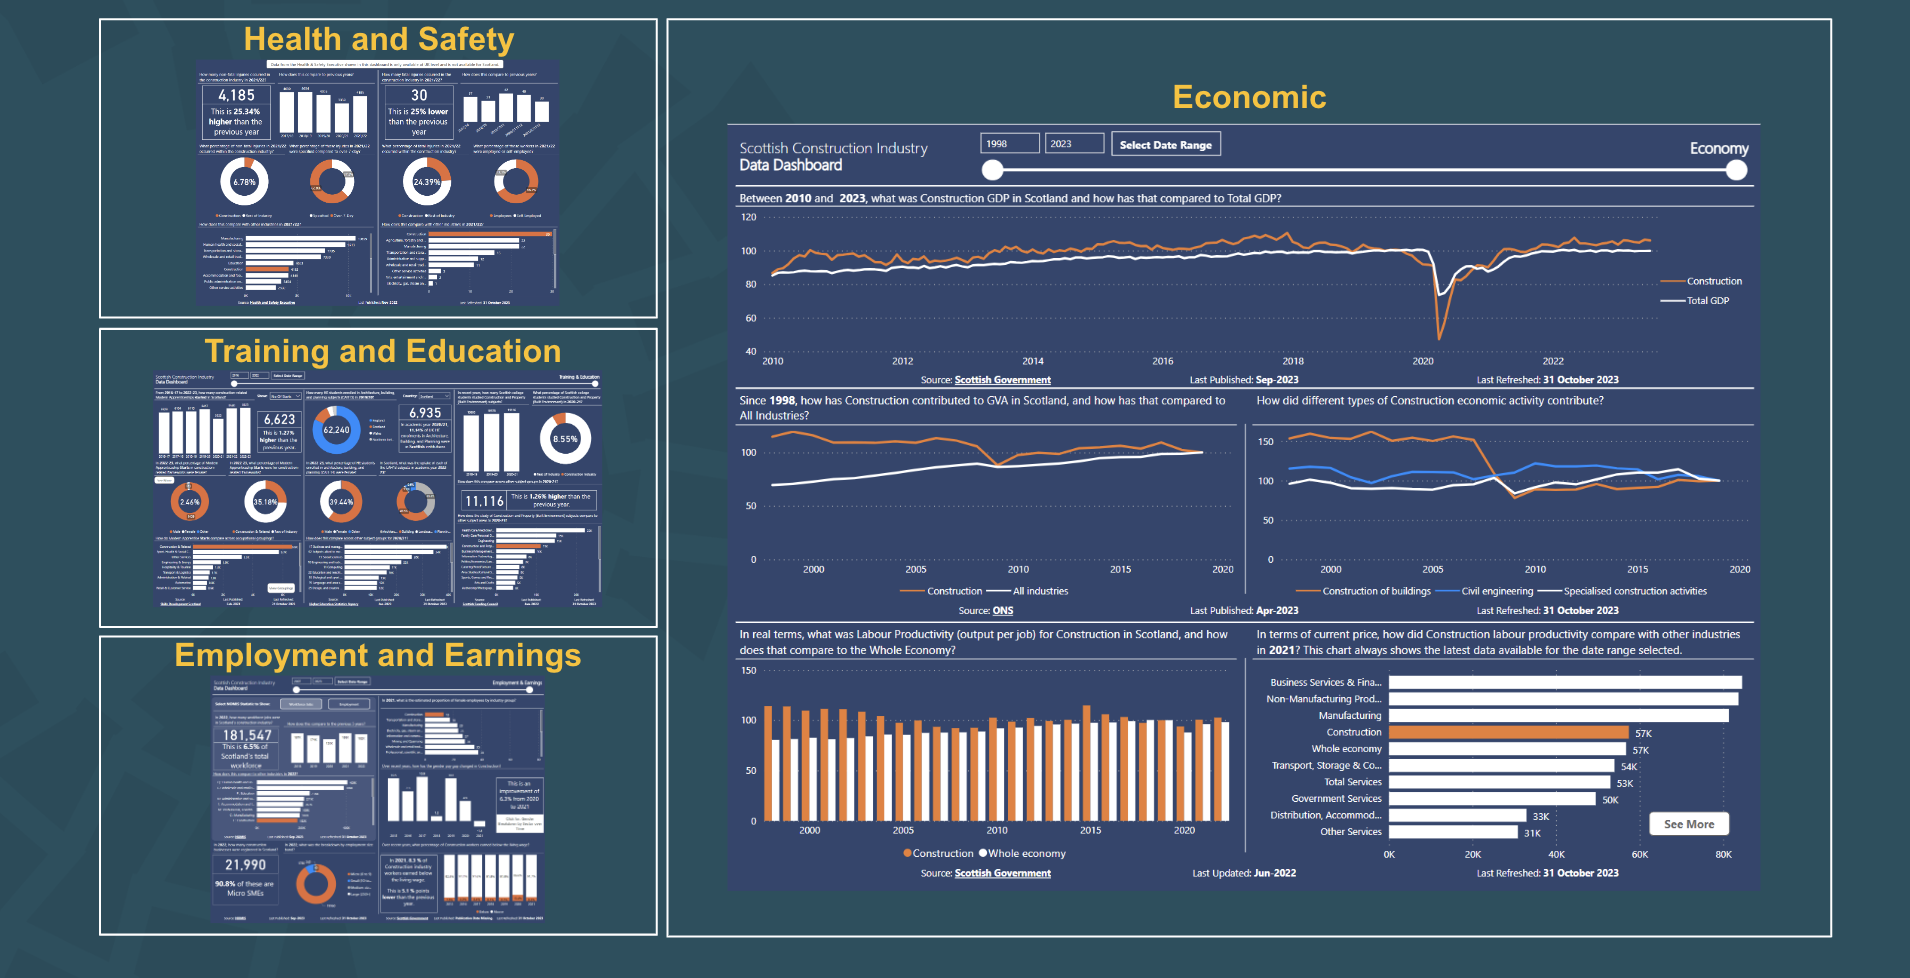
The four dashboards that are constructed on powerBI obtain daily refreshed data from Lumen® which ensures that the most up-to-date information is always presented. These dashboards provide a powerful visual insight that was previously unavailable within the Scottish construction sector.
By being able to view information coming from several organisations from the Health and Safety Executive to the Office of National Statistics, in a singular location, the time requirement for analysing the health of the sector at large has been greatly reduced. This has allowed those in the industry to make more informed decisions in less time than previously possible.